Inside the app
Most traders don't lose to the market. They lose to habits.
The same four traps show up in almost every blown account: winners left to turn red, sizing by feel, risk that was never measured, and standing in front of the market. Every page in Praxis is built to kill at least one of them.
The traps
Every blown account has at least one.
Ask a veteran what killed their early accounts and you will hear the same four stories. None of them are about picking the wrong stock — they are process failures, and process failures have fixes.
Winners that turn into losers
You are up, you do not take it, you ride it all the way back — and give a week of profit back in one afternoon. Green-to-red is not bad luck; it is an unwatched position.
Killed by: Live Risk (position heat, live R-multiples) · Analysis (how much of your winners you actually keep)
Position sizing by feel
Double size after a loss to win it back, half size after a scare — irregular sizing means two traders with the same trades get opposite results. Sizing is where edges are won or lost.
Killed by: Reality (Kelly-optimal sizing, over-betting alerts) · Behavioral flags (sizing on tilt)
Risk you never measured
Most traders cannot answer the only question that matters overnight: how much do I lose if every stop hits at once? What you have not measured, you cannot control.
Killed by: Live Risk (total risk at stops, VaR 95/99, missing-stop and oversize flags)
Standing in front of the market
Five positions that all fall together are not diversification — they are one oversized bet against the tape. Correlated books blow up on a single market move.
Killed by: Live Risk (beta, net exposure, correlation, stress tests from −5% to −35%)
Page by page
Ten pages. One system.
Each page does one job well. Two matter most for staying alive — they get the deepest tools below; the rest fall into the three moves of the loop.
The risk desk for your open book.
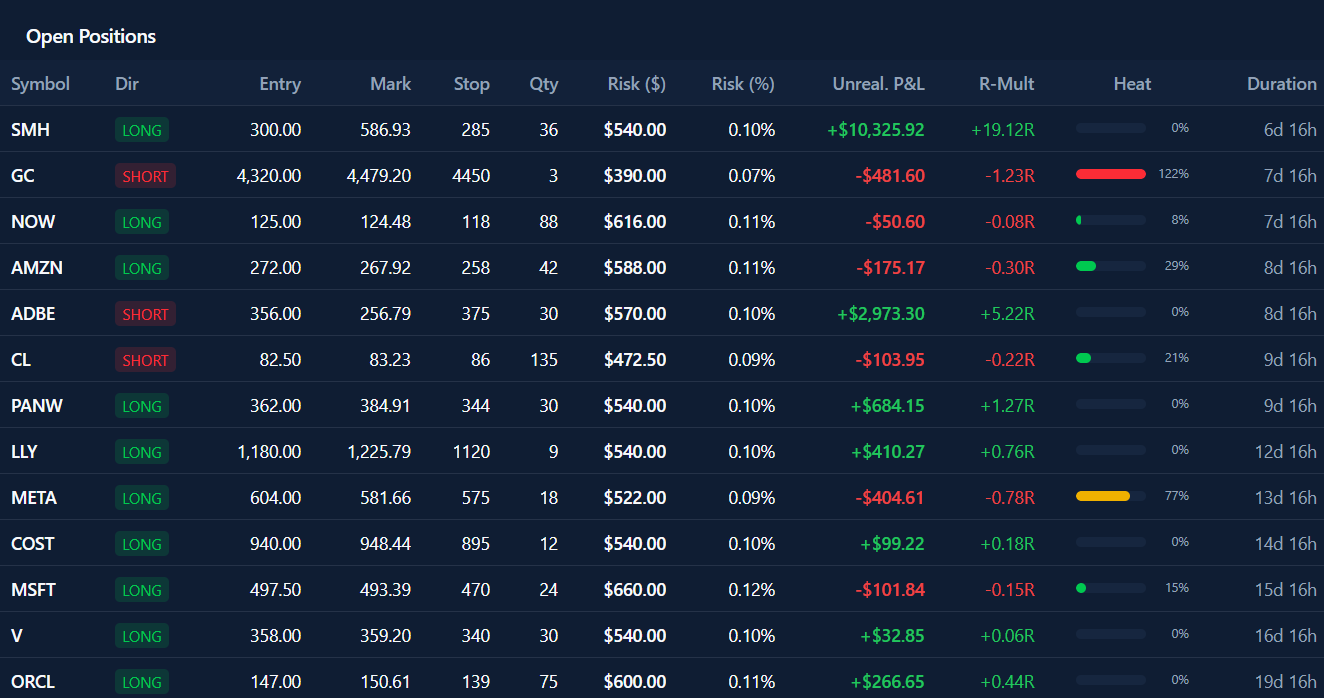
Where the Dashboard looks at what you have done, Live Risk watches what you are exposed to right now. Position heat shows every trade's distance to its stop — so green never quietly turns red. Total risk if all stops hit, VaR and stress tests, concentration and correlation warnings, missing-stop and oversize flags, and your own limits tracked live with a daily-loss circuit breaker.
This one page kills traps 01, 03, and 04 — the two classic account-killers, no stop and betting too big, are caught automatically instead of in the post-mortem.
A simulated look at your likely future.
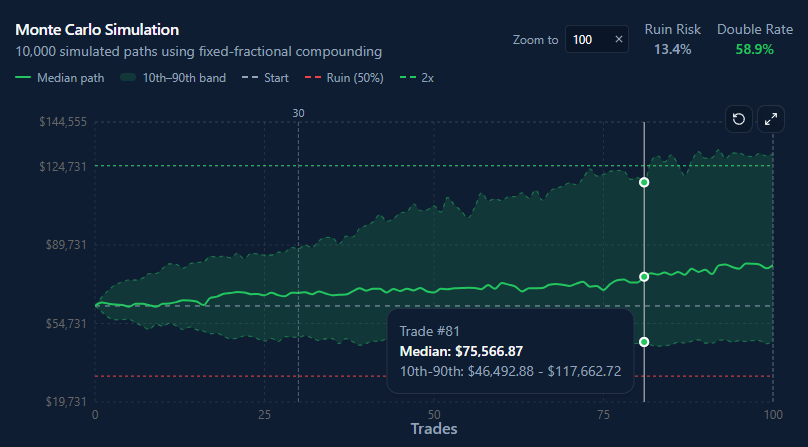
Thousands of possible futures built from your own trade history. An unsentimental verdict on your edge, your risk of ruin over the next 30, 100, and 250 trades, Kelly-optimal position sizing with a clear over- or under-betting call, realistic doubling time, and the right way to size back out of a drawdown.
This is where trap 02 dies. Sizing stops being a feeling and becomes a number — for most traders, seeing a real ruin probability is the wake-up call that finally fixes it.
The rest of the system
Eight more pages, in three moves.
Get clean, complete data in — effortlessly.
Add Trade
One click from anywhere, every asset class — with entry and stop captured so risk is accurate from the start.
Trades
The complete, searchable record of everything you have traded — the clean foundation every metric depends on.
History
Every position from first fill to flat, with the full transaction trail — a trustworthy audit for review and taxes.
Settings
Connect your broker once, calibrate to your real account, and set the risk limits the app then enforces for you.
See what happened, and why.
Dashboard
A five-second read on whether you are making money, how efficiently, and whether the trend is improving.
Calendar
Daily P&L mapped across the year, so the days and seasons you trade well — or badly — become obvious.
Analysis
Performance sliced by strategy, symbol, sector, and direction — so you fund the winners and cut what bleeds.
Journal
Notes, tags, and screenshots tied to each trade — the “why” that stops expensive mistakes from repeating.
Know yourself, and level up.
Profile
An honest trader scorecard with a Risk Radar — the self-portrait you improve, and eventually show a backer.
Learn
Every metric links to a plain-language explanation, so you grow as a trader just by using the tool.
The through-line
A process you can repeat.
Each page does one job, but together they form a loop: a trade syncs in, appears on the Dashboard and Calendar, its exposure is watched on Live Risk, its lesson is understood in Analysis and written down in the Journal — and Reality tells you what it all means for your future. Winning traders are not the ones with the most ideas; they are the ones with a process. This is that process, running by itself.
- Trade syncs in
- Dashboard & Calendar
- Live Risk
- Analysis
- Journal
- Reality
- Better next trade
Experience doesn't end the traps. A system does.
Connect your broker, and every page on this tour starts working on your real record — free to start, no card required.