Professional-grade trading intelligence
Your broker shows you what you traded. Praxis shows you what it means.
Connect your accounts to see your live portfolio risk, test whether your sizing and edge are sustainable, uncover where your performance actually comes from, and grade your complete trading operation — without spreadsheets or hours of manual analysis.
Read-only connections to 20+ brokerages and exchanges. Praxis cannot place trades or move money, and your brokerage credentials never touch our servers.
Connects to the broker you already use
Link your account once and every fill syncs automatically — no CSVs, no manual entry. Twenty-plus brokerages and exchanges, with more added regularly.














Profit is not the whole story
A profitable account can still be poorly managed.
A brokerage statement tells you whether you made or lost money. It does not tell you whether you took too much risk, leaned on one lucky strategy, oversized your positions, ran hidden correlated exposure, or built a process that can survive a difficult market. Praxis evaluates the operation behind the result.
You let green turn red.
A live drawdown detector flags every winner slipping back the moment it happens — before a good trade becomes a bad one.
Your report lists each trade that round-tripped from green to red, with the dollars you gave back.
You start locking profits instead of watching them evaporate.
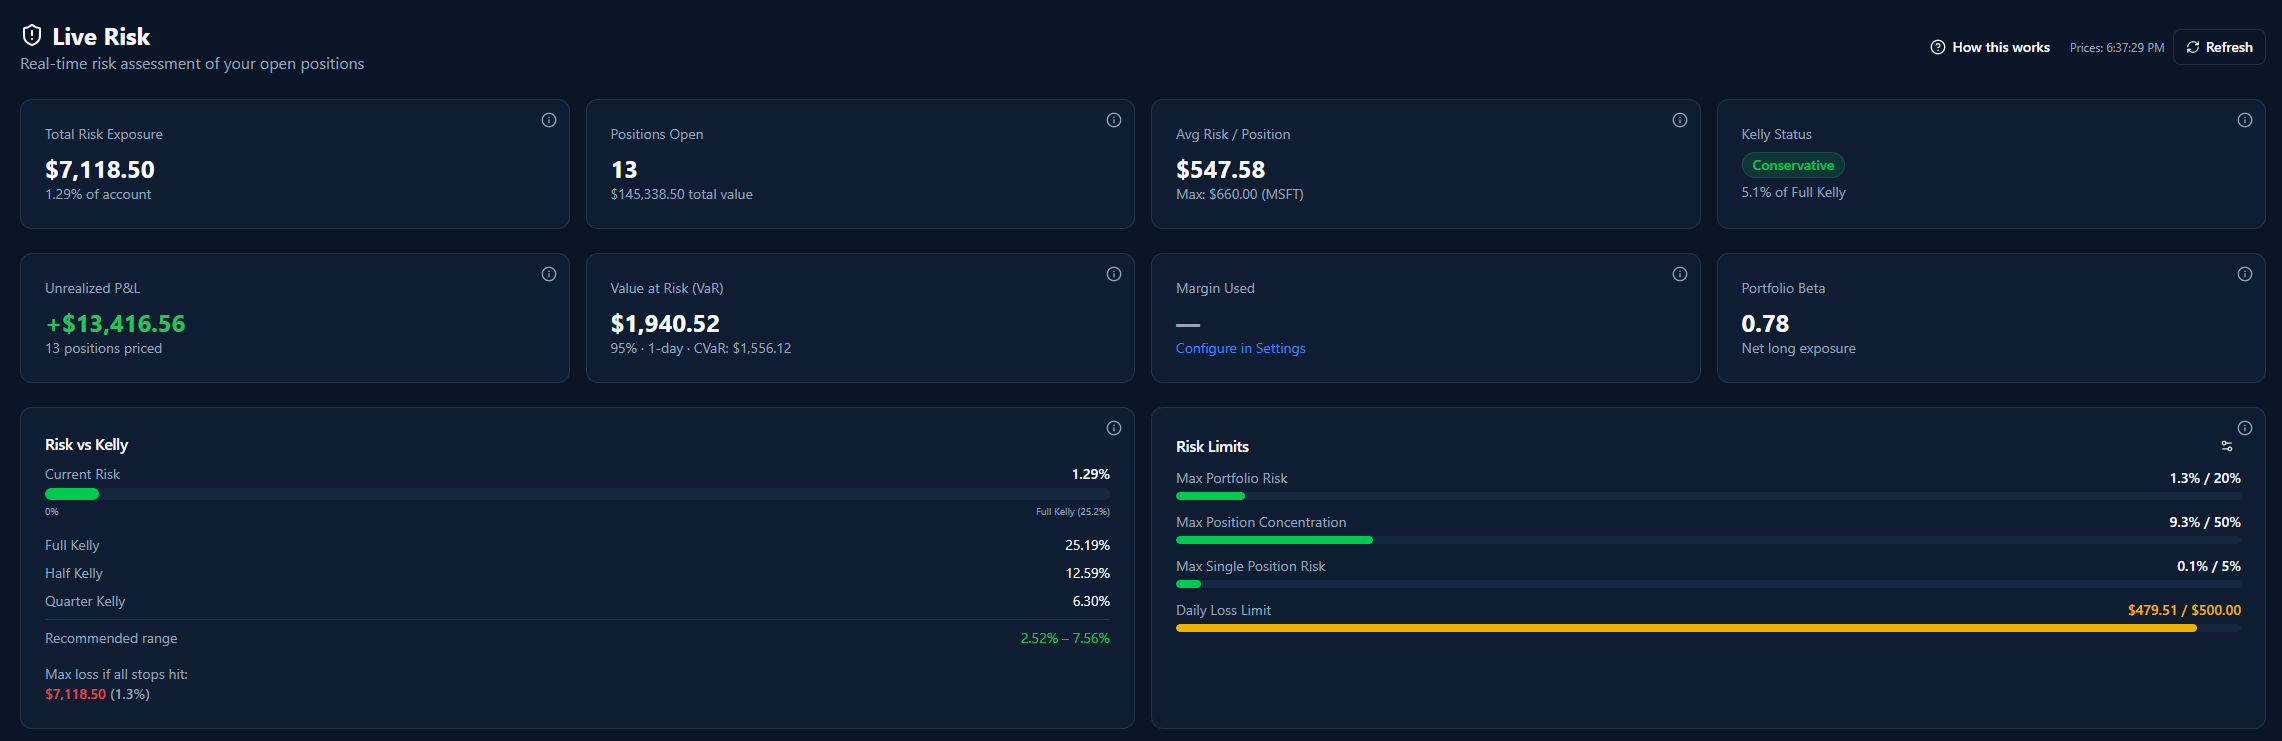
Live Risk · What am I risking right now?
See what you are risking right now.
A real-time risk desk for your open portfolio. Review total exposure, average risk per position, unrealized P&L, VaR and CVaR, margin, beta, correlation, liquidity, risk limits, stress scenarios, execution quality, and Kelly status — the way an institutional desk watches a book.
Total risk exposure
How much you truly have on the line right now — every open position’s distance-to-stop summed into one number, plus average risk per position and unrealized P&L.
VaR, beta & stress tests
Value at Risk and CVaR at 95% and 99%, portfolio beta, and your actual book shocked through adverse scenarios — from a normal bad day to a disaster.
Hidden correlation
Exposure broken down by symbol, sector, and direction. Positions that always move together aren’t diversification — they’re one larger bet in disguise.
Your limits, enforced
Position, portfolio, concentration, and daily-loss limits tracked live with ok / warning / exceeded status — plus margin, liquidity, execution quality, and Kelly sizing.
Reality Engine · Is the way I trade sustainable?
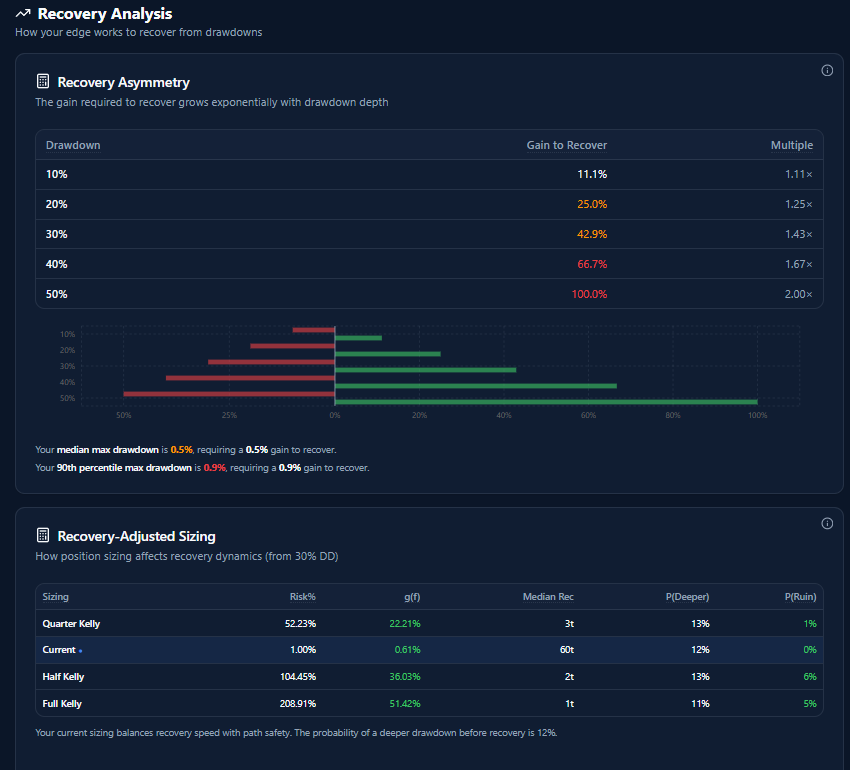
Test whether your edge and sizing can survive reality.
Past performance describes what happened. The Reality Engine estimates what your own trade distribution implies next — built from your R-multiples, with sample confidence made explicit:
- Expectancy, volatility, and log-growth from your R-multiples, with empirical and parametric modes and a stated sample size.
- Kelly benchmarks and professional sizing bands — and whether you appear to be over- or under-betting right now.
- Risk of ruin over your next trades, including conservative and adverse what-if scenarios.
- Recovery odds from every drawdown depth, from 10% to 50%, run over 10,000 Monte Carlo paths.
For most traders, seeing a real risk-of-ruin estimate is the moment their position sizing finally changes.
Analysis · Where does my performance come from?
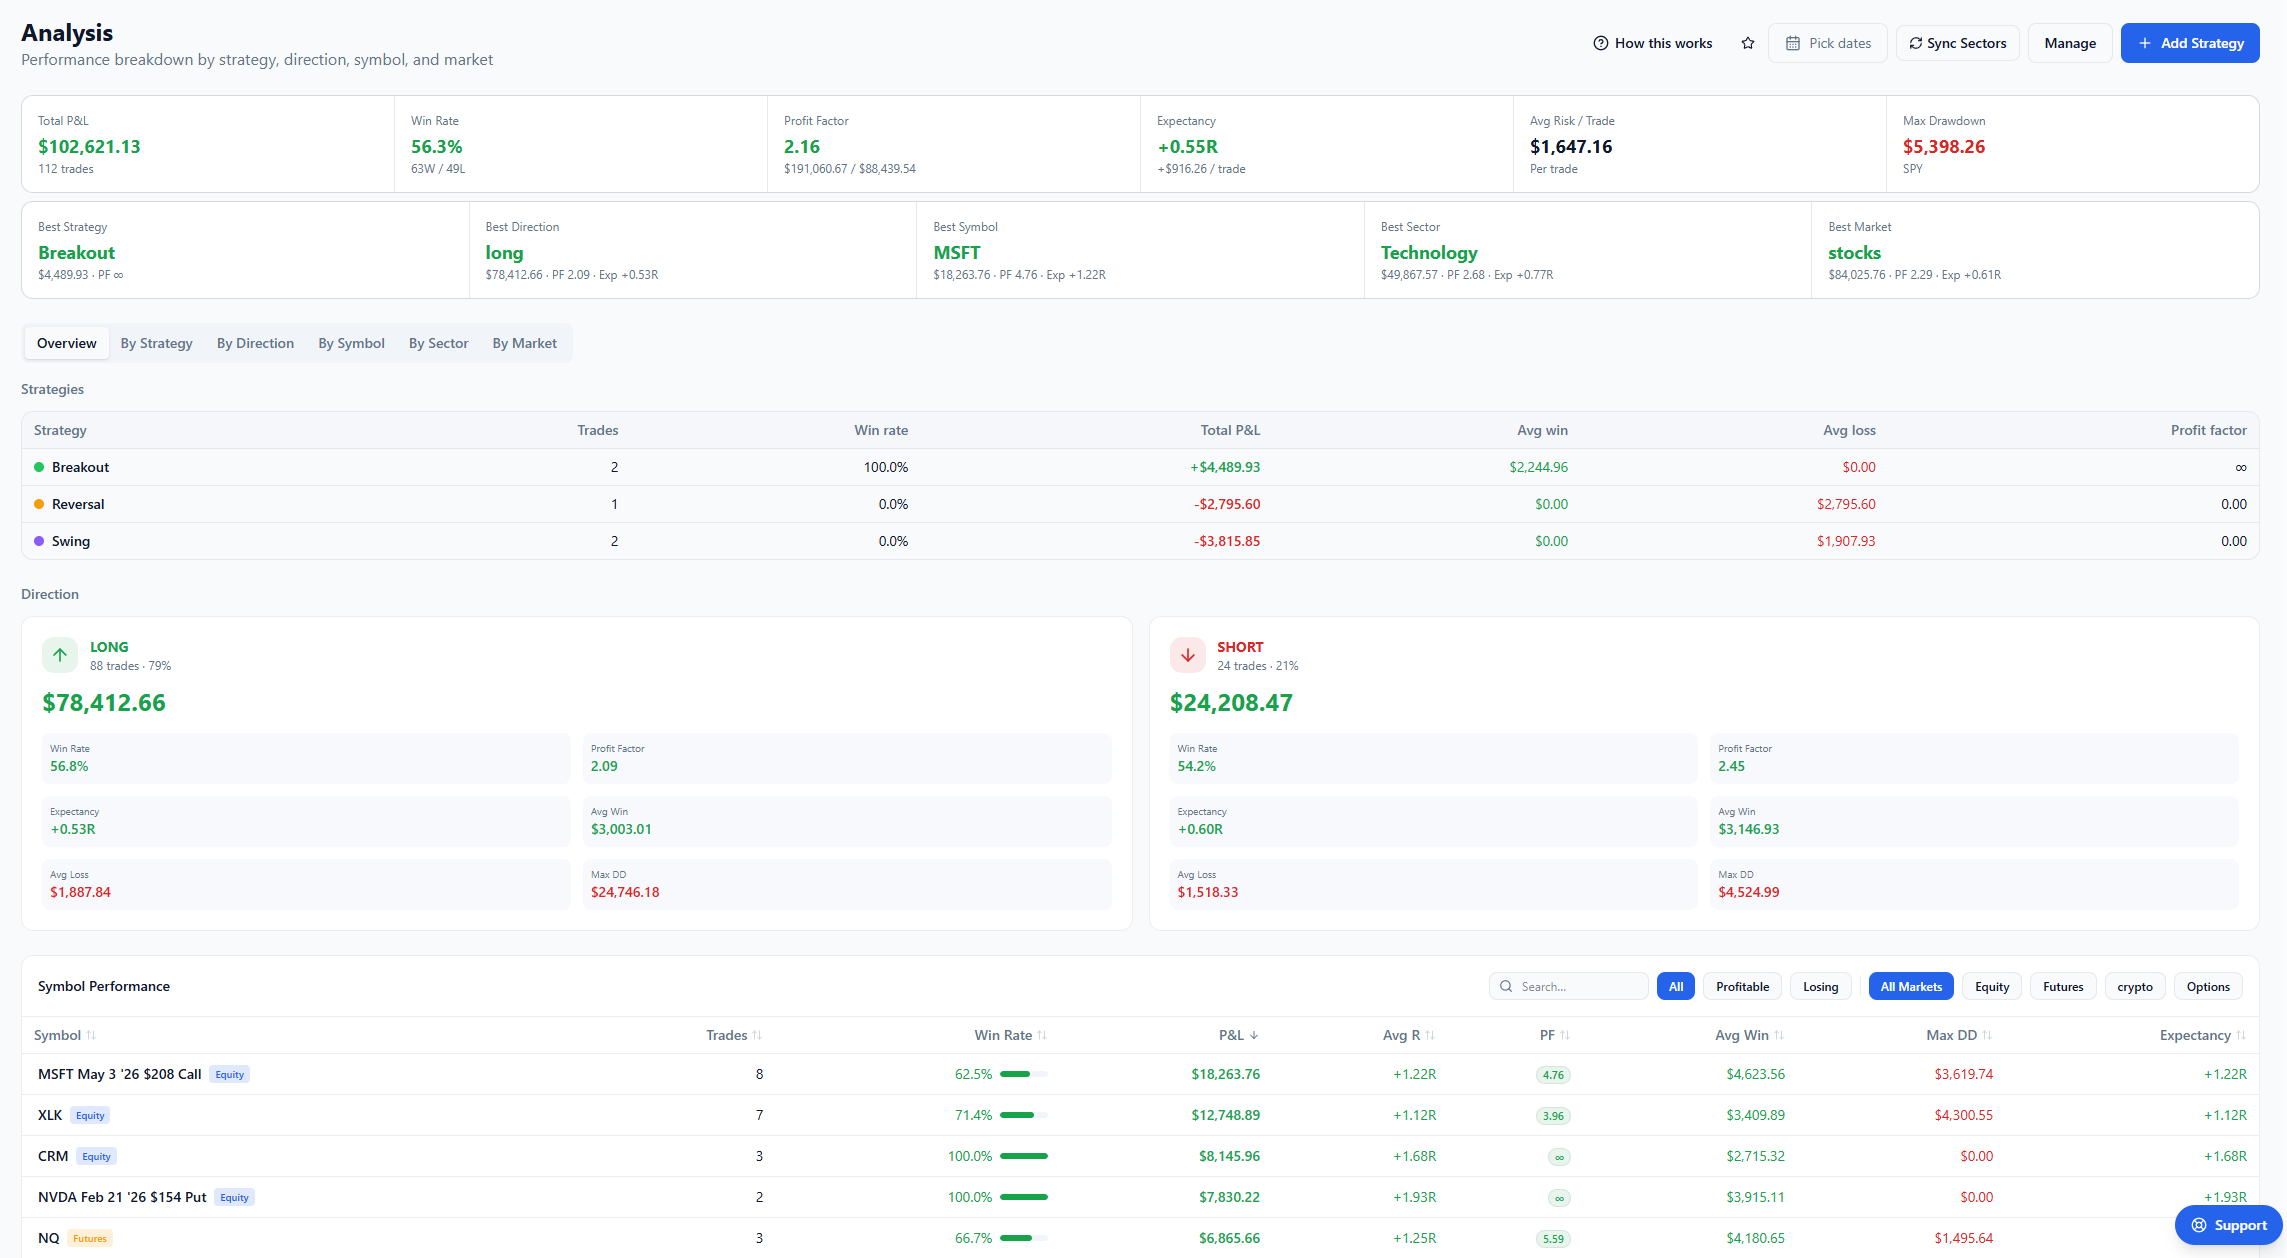
Discover where your performance actually comes from.
Break your results down by strategy, direction, symbol, sector, and market. Identify winners and losers, and use persistent strategy tags to see the conditions associated with your stronger and weaker results.
By strategy
Tag every position to a playbook and see win rate, profit factor, and expectancy per strategy — so you know which setups genuinely carry you. Tags persist across syncs.
By direction
Compare long and short performance side by side and find out which side of the market you actually trade well.
By symbol & sector
See which tickers and sectors produce your profits — and which quietly bleed the account.
By market
Break results down by market to learn where your edge lives and where it disappears.
Journal & Calendar · Review every day
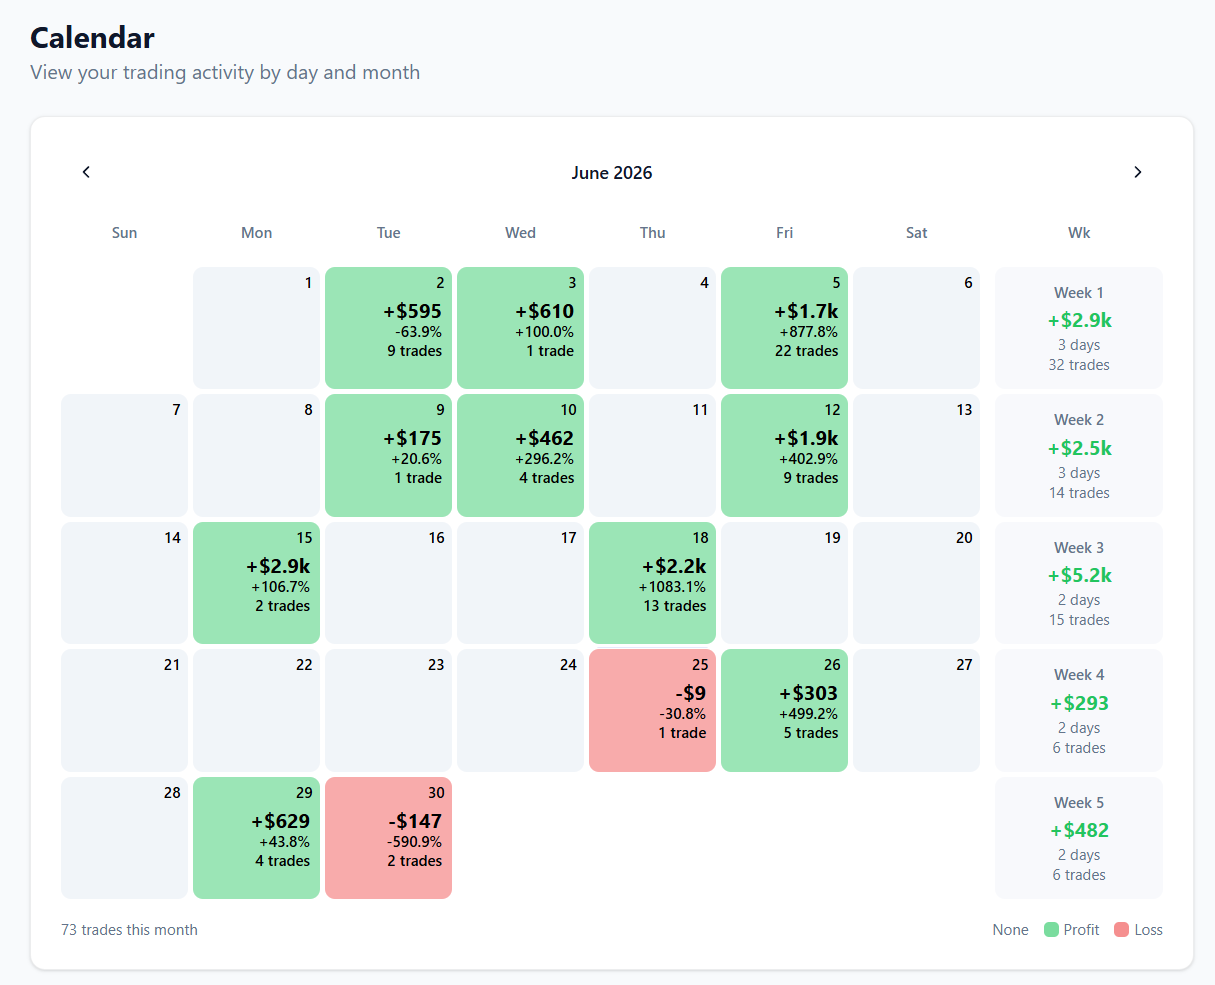
See your P&L take shape, one day at a time.
A month-at-a-glance calendar colors every trading day by P&L and rolls it up by week, so streaks and rough patches jump out. Pair it with a one-minute daily journal — moods, notes, and linked trades — to connect how you felt with how you actually traded.
ITGS · How strong is my overall operation?
Grade your trading like a complete operation.
The Institutional Trader Grading Standard scores your record on nine weighted pillars — risk-adjusted return, drawdown, edge quality, consistency, discipline, capital efficiency, track record, behavioral quality, and alpha integrity — into an AAA-to-D Performance Grade and a five-gate Allocator Grade.
Illustrative progression — the same account, nine months apart.
You don't start at an A — you build to one. The grade turns complex analytics into one number you can actually improve, measured every month and refined trade by trade.
From broker data to decision intelligence
Connect. Analyze. Understand.
Connect
Securely connect a supported brokerage, import a CSV, or enter trades manually. Connections are read-only — Praxis can never place trades or move money.
Analyze
Praxis organizes your history, reconciles positions, and calculates your performance, risk, sizing, edge, behavioral, and consistency analytics.
Understand
Use Live Risk, the Reality Engine, Analysis, your Trader Profile, and ITGS to understand what your results and open positions say about the whole operation.
The foundation under every insight
Your complete trading record, automatically organized.
Praxis turns brokerage activity into a structured trading record, connected journal, performance calendar, customizable dashboard, and Trader Profile — so you spend less time rebuilding trades and more time understanding them.
Automatic data engine
Read-only brokerage sync, historical backfill, FIFO matching, options handling, dividends, fees, transfers, CSV import, manual entry, and live position reconciliation.
Positions & orders
Open and closed positions, entry and exit charts, full transaction history, underlying-level grouping, editable orders, readable option labels, and persistent strategy tags.
Journal & calendar
Journal entries with moods, screenshots, and linked trades, plus calendar-based P&L review across days, weeks, and quarters.
Custom dashboard
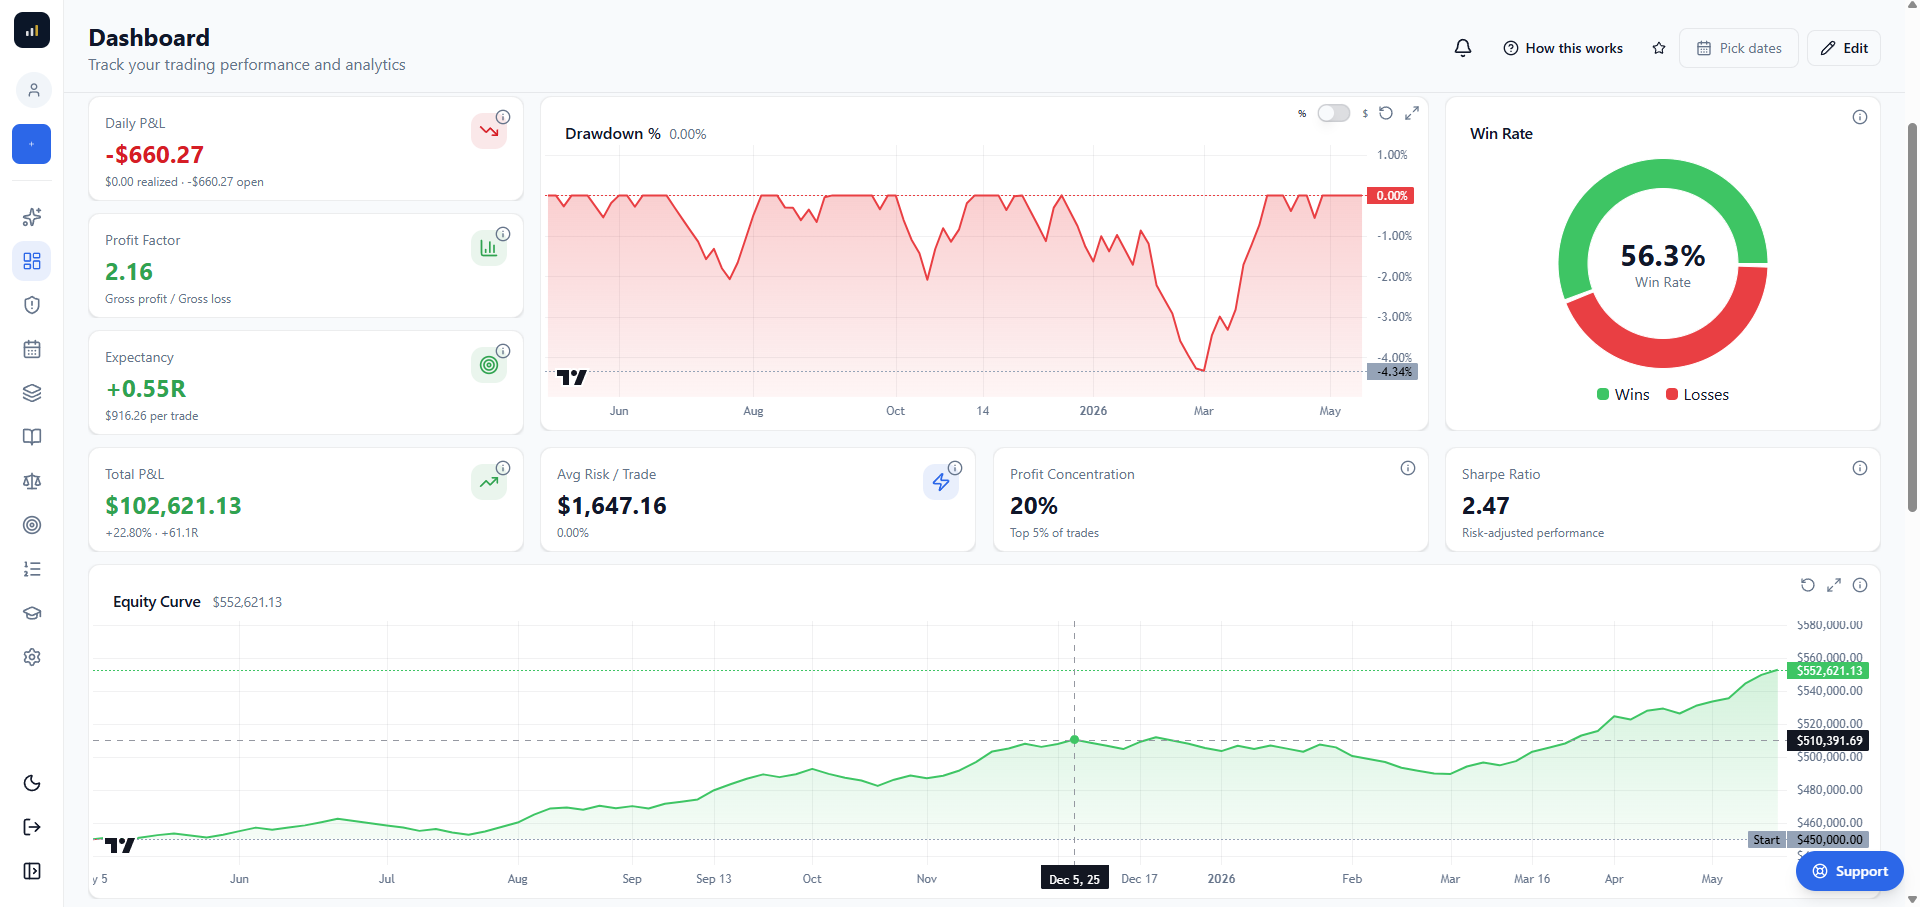
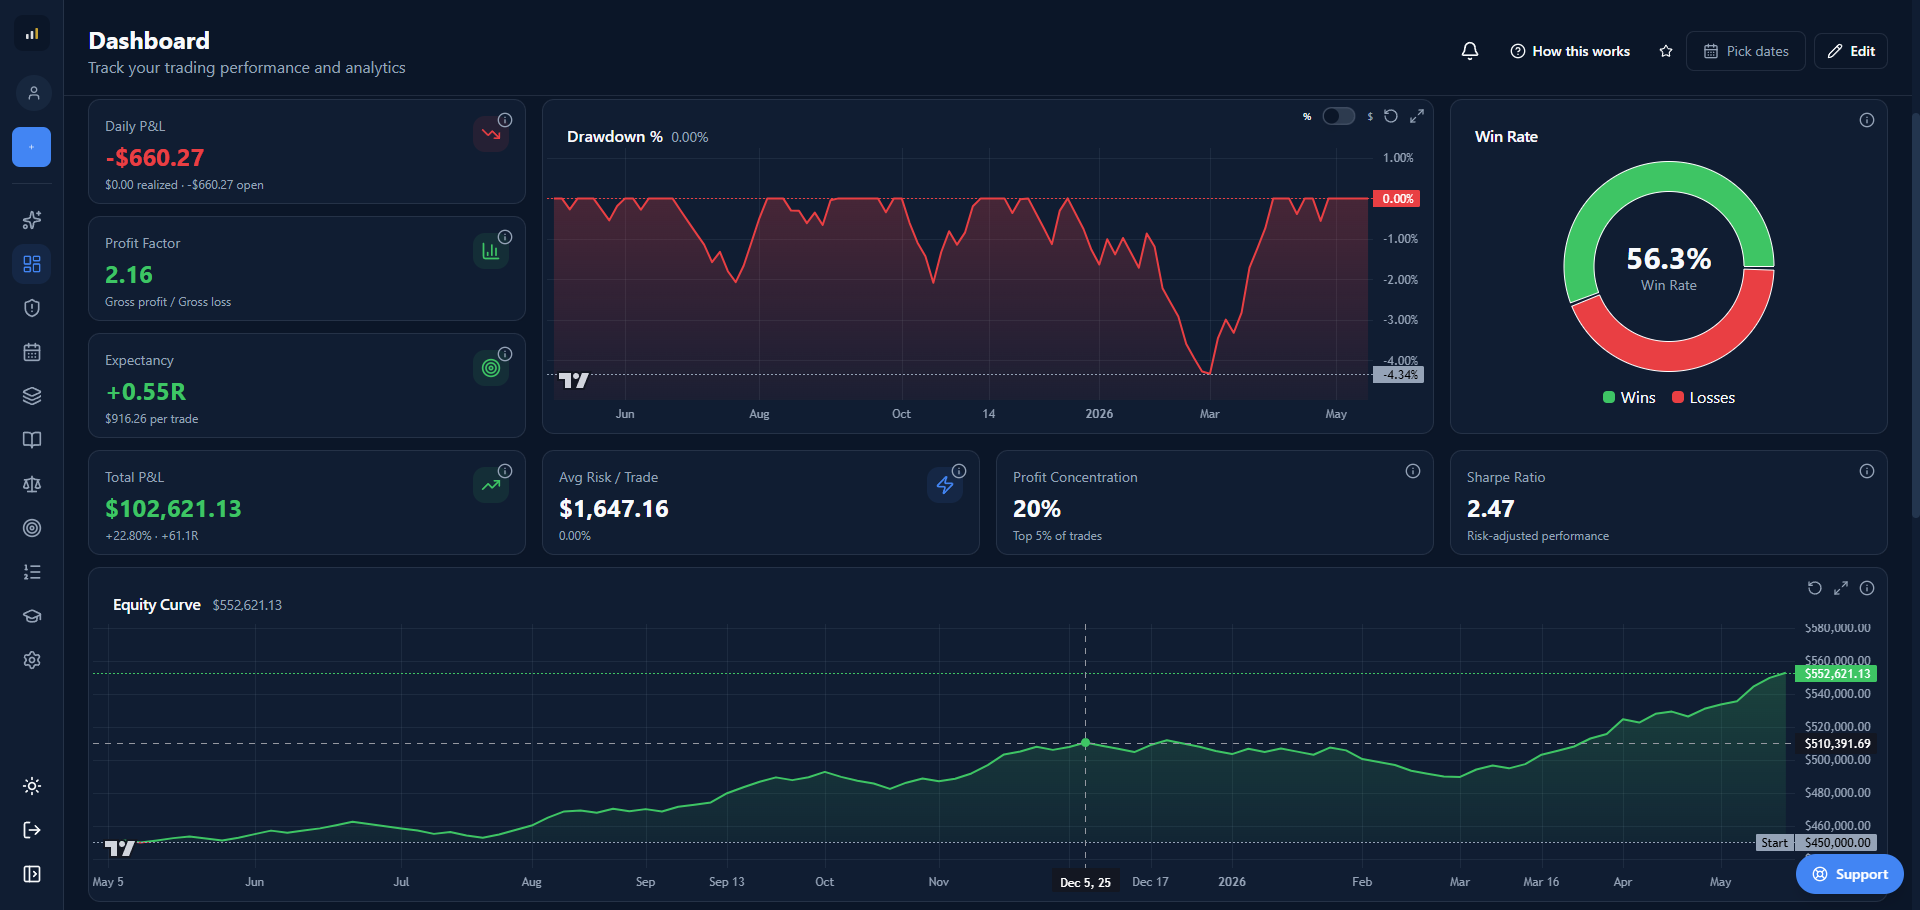
Draggable metric tiles, saved templates, equity curves, P&L, win rate, R-multiples, duration analysis, monthly performance, heatmaps, and drilldowns.
Trader Profile
A unified view of performance, risk, behavior, and consistency — executive metrics, equity curve, monthly returns, Risk Radar, and Risk Assessment.
Learn & support
A searchable Learn center, plain-language metric explanations, information popovers, page-aware FAQs, and in-app support.
Choose the depth you need
Track and understand your trading — or manage it like a complete operation.
Core
Track and understand your trading.
- Read-only sync, CSV import, and manual entry
- Positions, orders, journal, calendar, and strategy tags
- Customizable dashboard and performance charts
- Trader Profile with risk, behavior, and consistency
Premium
Manage your trading like a complete operation.
- Everything in Core
- Live Risk — real-time risk desk for open positions
- Reality Engine — sizing, risk of ruin, and Monte Carlo
- Analysis — breakdowns by strategy, symbol, sector & market
- ITGS — Performance Grade and Allocator Grade
Built for serious self-directed traders
For traders who want to understand the operation behind the P&L.
Praxis is built for active self-directed traders who already place trades but lack the infrastructure to evaluate risk, sizing, edge, behavior, consistency, and process quality with professional depth.
- You risk meaningful personal or family capital.
- You use multiple strategies, instruments, or accounts.
- You want portfolio-level risk — not only individual trade results.
- You are unsure whether your sizing survives a severe losing streak.
- You want to verify where your edge actually comes from.
- You have outgrown spreadsheets or a basic trading journal.
The point of all this
Trade with clarity and control.
Know exactly what you are risking, where the portfolio is vulnerable, which decisions help or hurt performance, and what deserves closer attention. Protect capital, reduce preventable mistakes, and build a repeatable process — without depending on hope, isolated wins, or manual spreadsheets.
Security & trust
Your account, handled with institutional care.
Connecting a brokerage should feel safe. Sync is read-only, secured through a bank-grade connection, and your data is encrypted and isolated to your own account.
Read-only by design
We read your trade history to analyze it — we can never place trades, withdraw, or move your money.
Your password stays yours
Brokerages connect through a secure, bank-grade link, so your brokerage credentials never touch our servers.
Encrypted and isolated
Row-level security keeps every account’s data separate, and it’s encrypted at rest in the database.
Never sold
Your data is yours alone. We never sell it, share it, or use it to train anything.
Understand the operation behind your results
See your risk. Test your edge. Grade your trading.
Connect your trading accounts and turn your real history and open positions into professional-grade intelligence about risk, sizing, edge, behavior, consistency, and overall trading quality.
Read-only connections. No trade execution. No money movement.